Visualization of the loss landscape and optimization path of a neural network
Published:
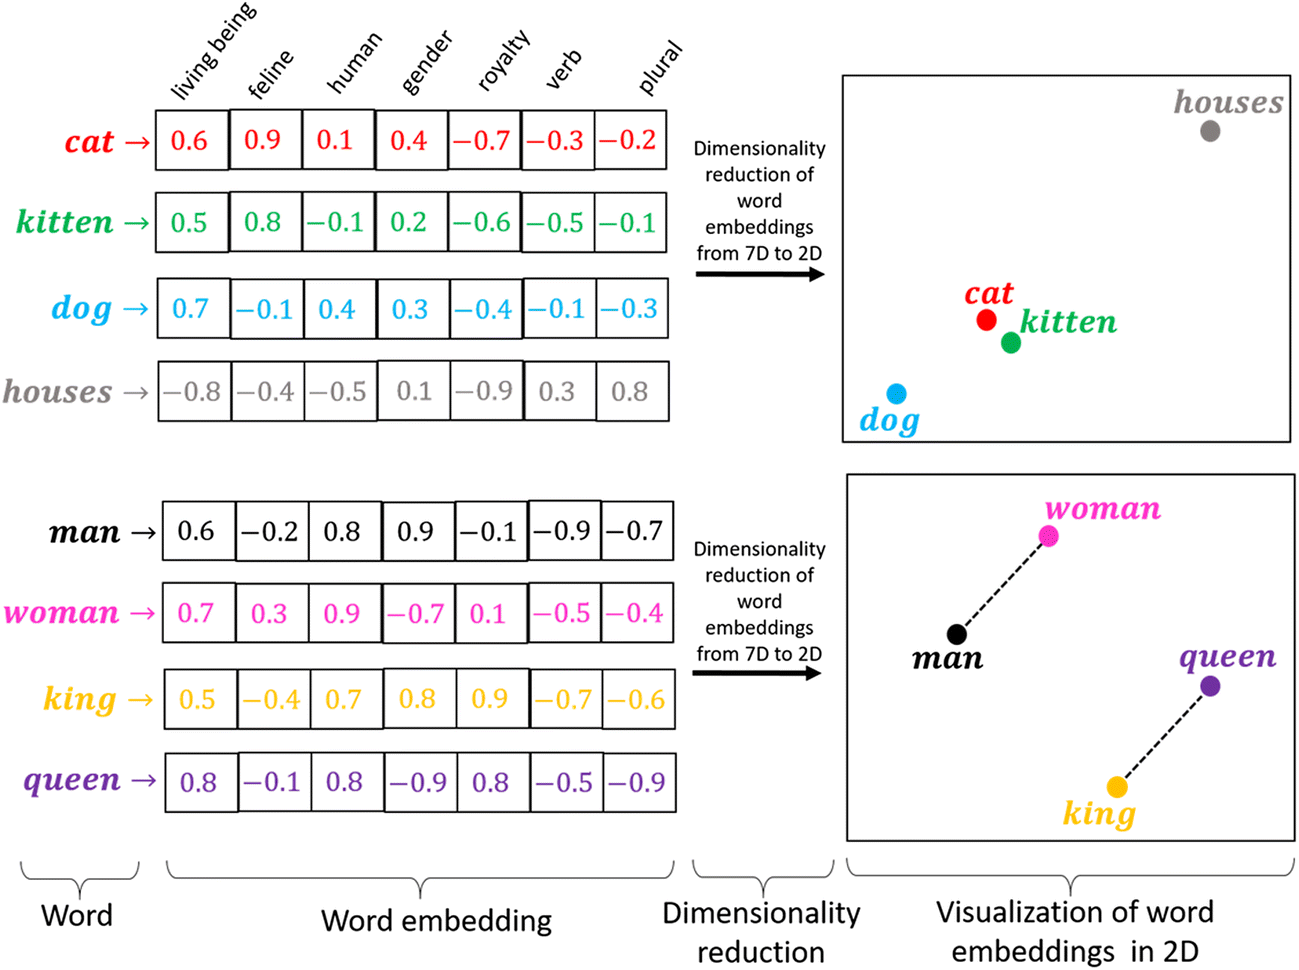
While neural loss functions live in a very high-dimensional space, visualizations are only possible using low-dimensional 1D (line) or 2D (surface) plots. Several methods exist for closing this dimensionality gap. The idea is to choose a linear subspace that maximally preserves the optimization trajectory’s shape, in order to observe patterns that are meaningful in the full parameter space.
See the hackmd version. I’ll copy it, format it in markdow and put it here as soon as I can.